


Big, Beautiful Data
DEMS and REMS - but not politics nor dream states

I had planned to write this first newsletter on streams and floods in response to the horrific recent events in Kentucky, my home state and in northern California, my newly adopted state. The flooding of the North Fork Kentucky River and the fish-kill from sediment turning the Klamath River into a river of mud highly impact the residents who live along their banks. The interaction of fire and water, climate and weather, topography, people and their relationship to waterways – it could have been a very long, depressing piece.
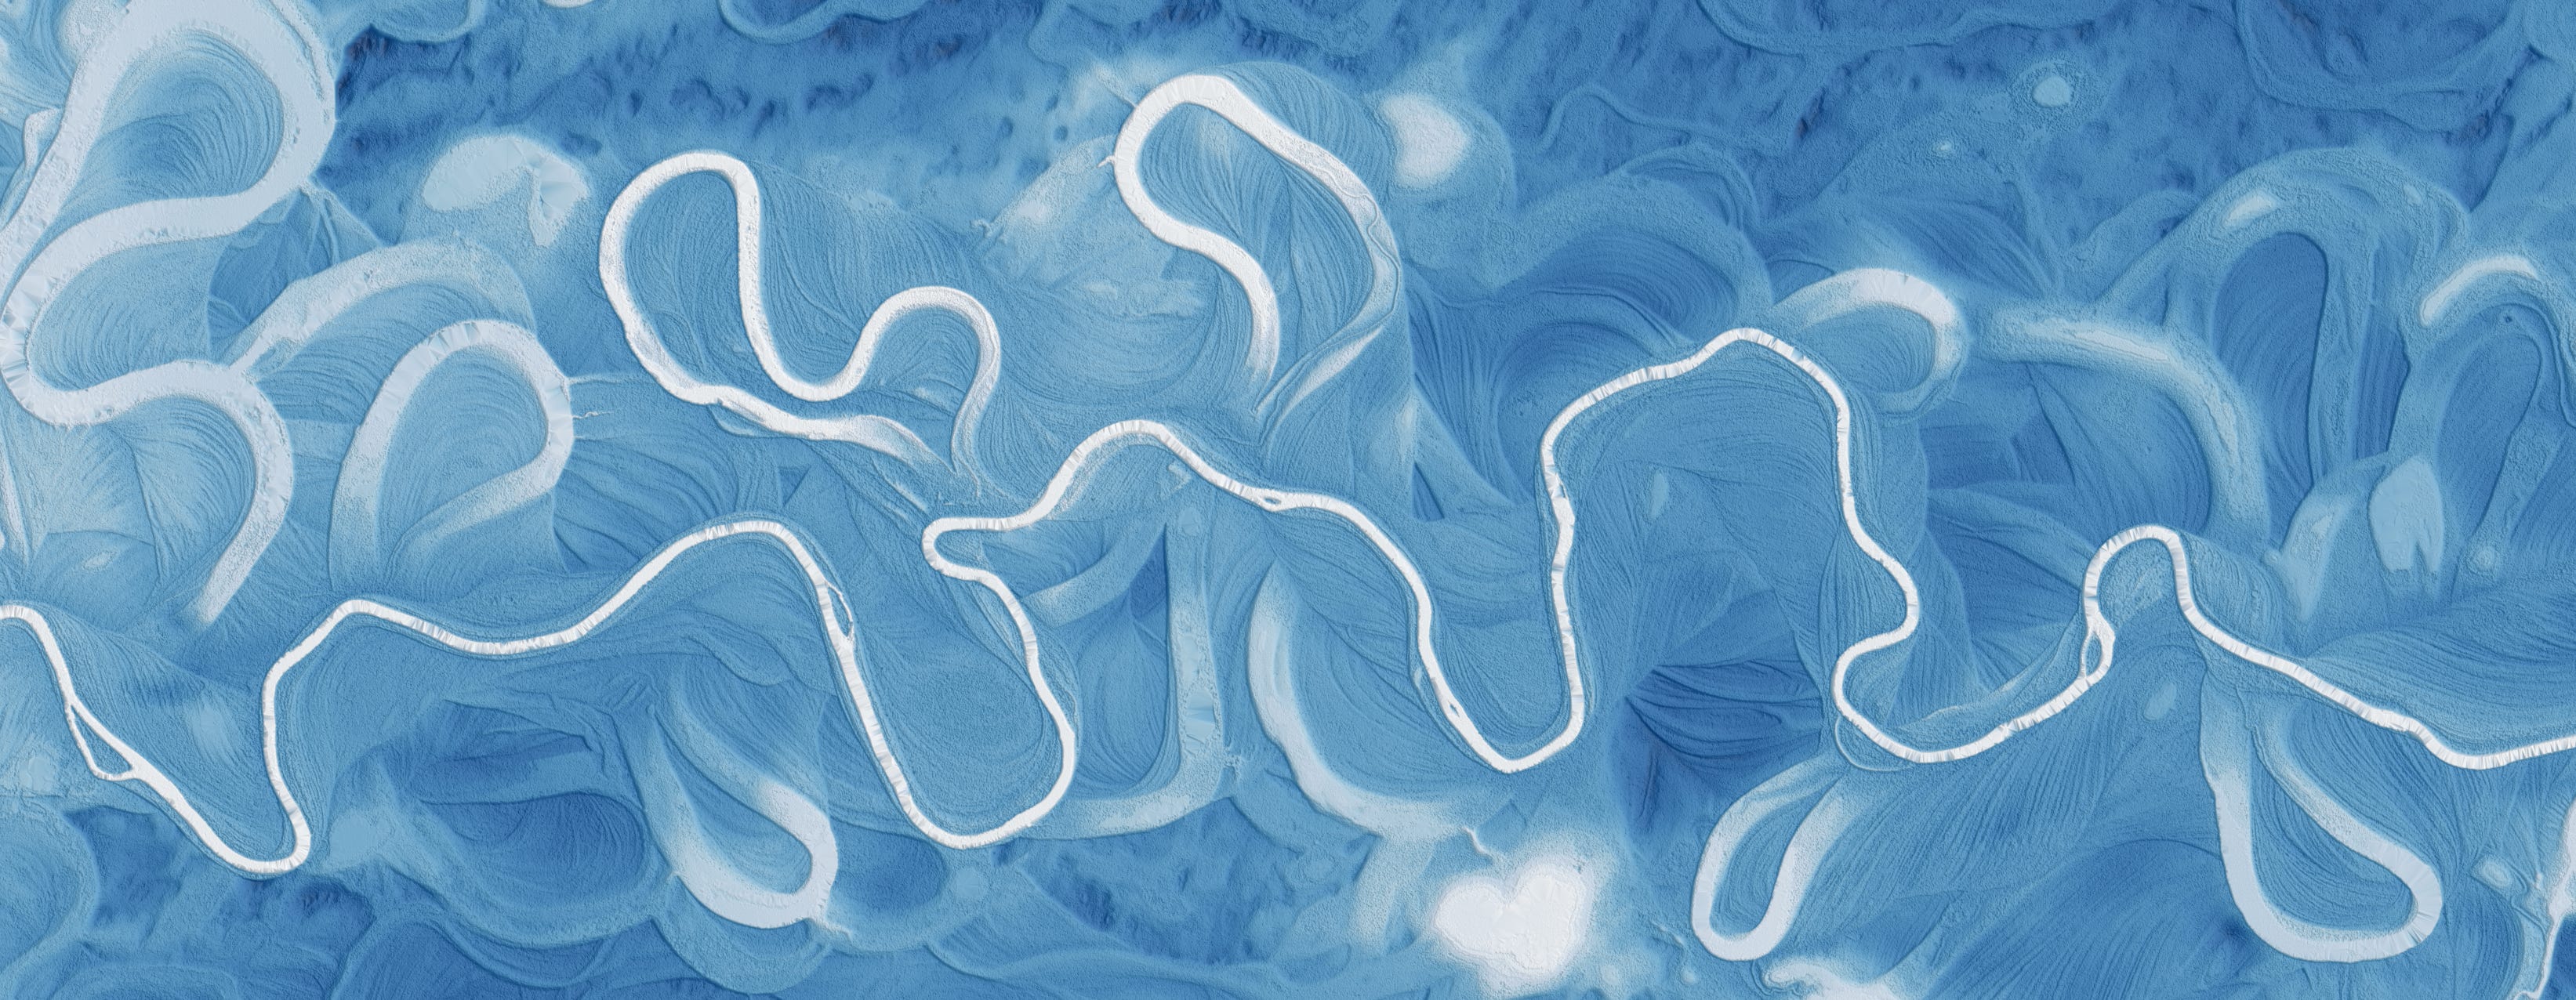
But my Twitter feed saved me, for when I checked my phone before turning out the light a few nights ago, there sat a most beautiful digital map of a river showing the Earth sculpted by water over time. The river has meandered back and forth, moving rocks and silt, cutting embankments, and dropping its load only to have it move again in a constantly changing pattern. The Earth has left a record of these changes, talking to us about what it’s been up to. But we would never see the complexity of the movement without a LOT of data.
The opening image in this newsletter is a magnificent compilation of scientific data from a technology called LIDAR (Light Detection and Ranging) which is a remote sensing method that uses light in the form of a pulsed laser to measure variable distances to the Earth. In this case, the data was collected from an airplane. Each point represents a point in space making a point cloud which is turned into a digital elevation model. The changes in elevation of a stream were removed so we could better see the local variations in topography (REM or relative elevation model).
Data visualization is so important today with the huge amounts of data produced by modern technology. This image started out as a 1.2 GB point cloud turned into an image accessible to us on our phones or computers – in bed, on the couch, over a glass of wine, or in the lab or office.
When I joined a university research consortium in 2004, LIDAR was relatively new, and very few people knew how to use it. Obtaining the data was hard, and it was a bear to manipulate the data into some semblance of a 3-D image. A land-based unit was in the six-digit price range, and air surveys were limited in scope. And today I discover that certain iPhones now have LIDAR built in! I normally don’t get the newest phone but…tempting.
As a geologist, my love of data is embedded in my bones. I’ve measured a lot of rocks, read many scientific papers and written a few over the years, and yet - here I am, again flabbergasted at the beauty of the Earth and the beauty of the data we get from the Earth.
Intrigued?
You can see more of these fabulous images and learn more about LIDAR at the Open Topography website and, for those of you educationally inclined, check out their teaching resources.
More of my thoughts on visualization of data at my website susaneriksson.com
Although my newsletters are definitely not exclusively educational in nature, I just can’t help pointing you to Project EDDIE, an earth system/macrosystem ecology, and environmental data project. They and many other projects are helping education a new generation of students in how to interpret and think about these gigantic data sets which drive science today.
Something I read this month
It is exciting to find new writers, new magazines, new books, and I always wonder “why have I never heard of this person before?” I feel a bit foolish not to know the name of Meera Subramanian who writes about the land, about the Earth and its people. Her recent essay, A Pointed Angle, is featured this month in the online version of Orion Magazine, a publication I’ve only subscribed to for a couple of years. Meera based her essay on a letter in her family’s archives written in 1847 by a young cartographer in Texas. He helped make the first maps of Texas.
Why do I note this particular essay in this newsletter? Our opening image above is made by geodesists, i.e. geoscientists who measure the shape of the Earth. Each spot on the image represents a mapped point. I pointed out that we now can hold LIDAR technology in our hands.
In The Pointed Angle, Subramanian writes that her ancestor did his mapping with a few simple objects: a sixty-six foot steel chain, a writing instrument and paper, and a compass – simple tools that changed the landscape from open space to land defined by boundaries, wrenching the land from the Indigenous people.
What will you do with your iPhone LIDAR?
A fun thing
Watch the first of short videos on ‘Why I love this rock’.
More about Earth to Susan
I am writing a book about how people see the Earth in different ways. As part of the writing process, I’ve held my book’s content close over the years. I am now ready to put some of it out into the world. So I will bring science, poetry, music, theology, literature, philosophy, history, geography, politics, and economics to these pages – all in relationship to Earth.
Most importantly, I believe that helping people understand that we all see the Earth in different ways will open conversations to help find solutions for the many issues facing the planet we call home.
I plan on one newsletter per month, and I hope you will continue to read this and share with your friends! It’s free.
Until next month,
Susan
Wonderful first post! Thank you for sharing your views of the world with all of us.
Nice newsletter launch, Susan! I enjoy the variety and the stunning image.